

You would not run a business without checking your numbers. Revenue, pipeline, client retention — all tracked, all reviewed. But most professionals have no idea how healthy their network is. How many relationships have gone cold in the last six months? Which contacts are due for outreach? Where are your referrals actually coming from? Personal CRM analytics answer these questions — and the answers are often surprising.
Key Takeaways
|
What Network Health Actually Means
Network health is not the size of your contact list — it is the warmth, recency, and quality of the relationships within it. A network of 500 people where 400 have not heard from you in over a year is not healthy. A network of 80 people you are in consistent, meaningful contact with is.
The metrics that matter are relational, not volumetric. How recently did you speak to each contact? How often are you maintaining the cadence you set? What percentage of your outreach is getting a response? Which relationships have warmed up, which have cooled, and which have gone dormant?
Network analytics are a diagnostic tool. They tell you where you are versus where you want to be — and they make it possible to intervene before a good relationship becomes a forgotten one.
Key Metrics to Track in Your Personal CRM
Touchpoint frequency by tier: are you hitting your intended cadence for each relationship tier? This is the most fundamental health check. If you set monthly contact for your top 20 relationships and the average is quarterly, you have a gap worth closing.
Response rate: when you reach out, what percentage of your contacts reply? A high response rate suggests your outreach is landing as genuine and valuable. A low rate might indicate you are contacting people in ways that feel impersonal or irrelevant.
Referral source tracking: where is your new business coming from? Map each referral or new client back to a relationship in your network. Over time, this shows you which relationships are generating business value — not just warmth — and helps you prioritise your energy accordingly.
Reading Your Relationship Data
The most important data point is relationship decay: contacts whose last touchpoint was more than two times the intended cadence ago. These are relationships that have drifted without you noticing. They are your highest-priority re-engagement targets — because they are warm enough to recover, but cold enough to require deliberate action.
Look also at response patterns. A contact who used to reply promptly and now does not may have moved on, changed roles, or simply drifted. A contact who was dormant for a year and suddenly responds enthusiastically to a re-engagement message is signalling potential — follow up.
Review your referral source data quarterly. If you discover that two or three relationships are responsible for 80% of your referrals, you have identified your most important networking assets — and you can invest proportionally more time in those relationships.
Turning Analytics Into Action
Analytics without action are trivia. The value of network health data is in the behaviour it prompts. Weekly: act on your due-outreach list. Monthly: review which relationships have drifted and schedule specific re-engagement. Quarterly: audit your referral sources and check whether your most important relationships are receiving the attention they deserve.
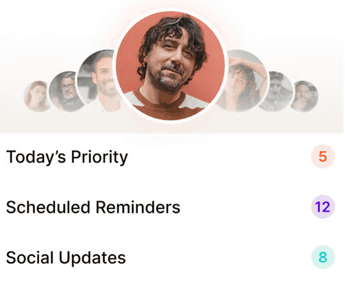
Regards surfaces this data in a lightweight, actionable format — not a dashboard full of charts, but a weekly list of who needs attention and context to make the outreach land. The analytics are built into the workflow rather than being a separate review exercise.
The professionals who maintain the healthiest networks are not the ones who do the most networking — they are the ones who are most consistently attentive to the right relationships. Analytics tell you what consistent attention actually looks like.

Why we built Regards
I’m bad at staying in touch. Not because I don’t value people. Its a lot of work, and I didn’t have a system. This started as my fix. A quiet assistant that helped me nurture relationships thoughtfully. When people noticed the difference and asked what I was doing, it slowly evolved into a product. And the love has been incredible. Regards, Khuze

Frequently Asked Questions
What is the most important metric to track in a personal CRM?
Touchpoint recency by relationship tier — whether you are actually hitting the cadences you set for your most important relationships. Everything else is secondary to this fundamental health check.
How often should I review my network analytics?
A brief weekly review of due-outreach contacts is the minimum. A more comprehensive monthly review of relationship health trends and a quarterly referral source audit are valuable additions.
Can personal CRM analytics help me identify which relationships to invest more in?
Yes — referral source tracking over time shows which relationships are generating real business value, not just warmth. This data makes prioritisation decisions much clearer.
Is there a risk that treating relationships analytically makes them feel less genuine?
The analytics inform the system, not the conversation. Knowing that a contact is overdue for outreach does not make the outreach less genuine — it just makes sure it happens. The message itself should always be personal and contextual.
What does a healthy network look like numerically?
As a rough guide: your top 20–30 contacts heard from you in the last 30 days; your secondary tier (50–100 contacts) heard from you in the last 60–90 days; your broader warm network (100–200 contacts) heard from you in the last six months. Anything beyond six months is drifting into cold territory.